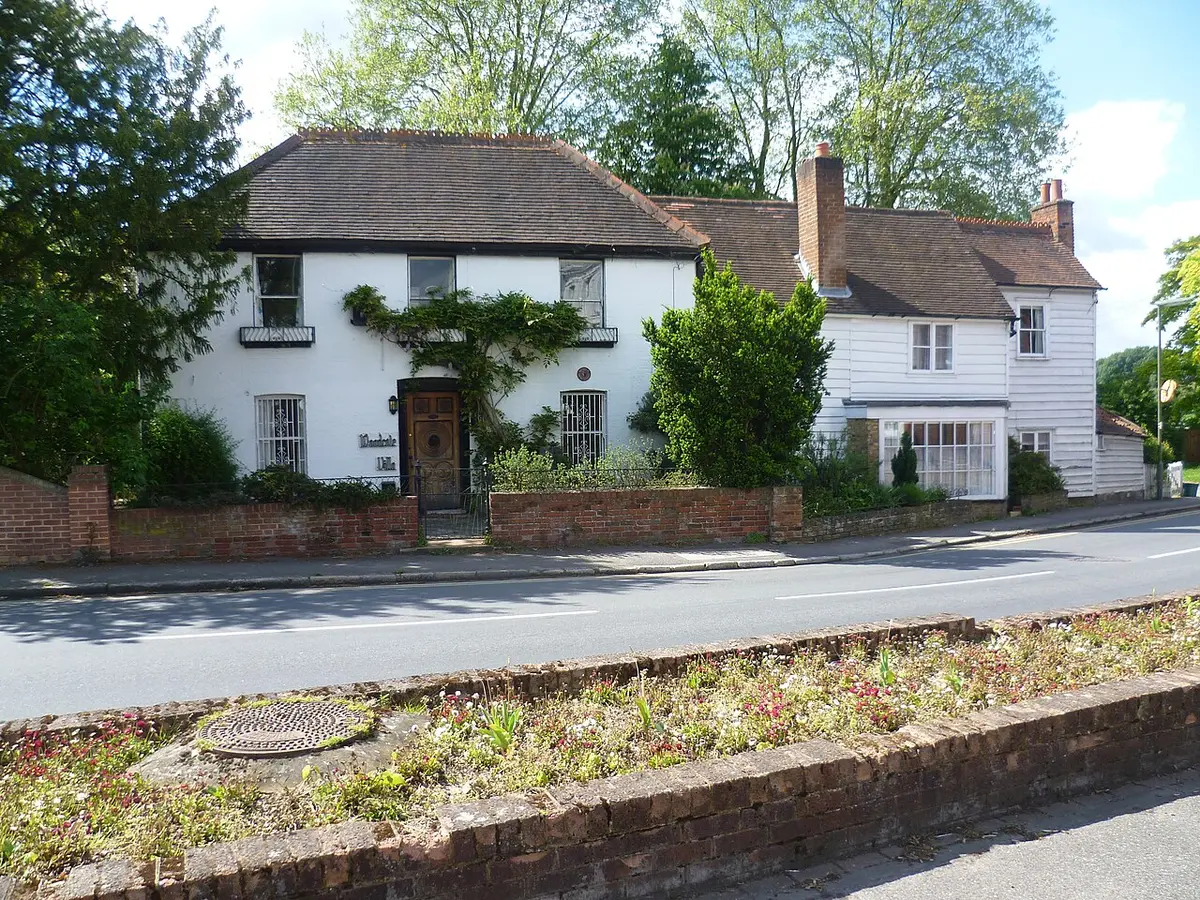

The average Epsom and Ewell home sold for £568,214 in July 2026, up 2.0% while Surrey as a whole fell 0.4%. Prices by type, and where the borough ranks.
The average home in Epsom and Ewell sold for £568,214 in July 2026, and it is still one of the few parts of Surrey where prices are going up. The borough rose 2.0% over the year while the county as a whole fell 0.4%. Six of Surrey’s eleven districts lost value over the same twelve months.
Those are UK House Price Index figures, built from completed HM Land Registry sales rather than asking prices. They cover Epsom and Ewell borough, which is the smallest district in Surrey by area: Epsom, Ewell, Stoneleigh, Worcester Park, West Ewell, Langley Vale and the Downs. They do not cover Ashtead or Leatherhead, which are in Mole Valley, or Banstead and Tadworth, which are in Reigate and Banstead. Those are different markets with different numbers, and the boundary runs closer to Epsom than most people assume.
The headline figure is an average across a whole borough, and it is a geometric mean rather than a median. Treat it as a description of the market, not a valuation of any particular house.
The headline figures
| Measure | July 2026 |
|---|---|
| Average price, all property types | £568,214 |
| Change over 12 months | +2.0% |
| Change over the month | −0.4% |
| First-time buyer average | £422,793 |
| Former owner-occupier average | £703,851 |
| Index (January 2023 = 100) | 100.8 |
The index line matters more than it looks. On the Land Registry’s scale, where January 2023 is set at 100, Epsom and Ewell reads 100.8. Three and a half years on, the borough average is £4,307 higher than it was at the start of 2023. That is a recovery, but a shallow one. The Surrey index sits at 98.7 and the South East at 98.2, so both are still below where they started. England reads 102.7.
The gap between the two buyer figures is the real number for anyone moving within the borough. A first-time buyer paid £422,793. Somebody selling one home here to buy another paid £703,851. That is a step of £281,058, and it is why so many local moves in Epsom and Ewell are people going from a Stoneleigh or West Ewell flat straight out of the borough rather than up within it.
One caution on the monthly line. Prices dipped 0.4% between June and July, after four monthly rises from February to May and a flat June. One month is not a trend, and the Land Registry revises the previous twelve months at every release, but it is worth knowing before reading the annual figure as momentum.
The semi-detached house is the outlier
| Property type | Average price | Change over 12 months |
|---|---|---|
| Detached | £982,917 | +2.2% |
| Semi-detached | £649,771 | +3.5% |
| Terraced | £491,420 | +3.2% |
| Flat or maisonette | £300,022 | −0.4% |
Set those against Surrey and one figure jumps out. A detached house here averages £982,917 against a Surrey average of £980,992, so barely £2,000 apart. A semi-detached house averages £649,771 against a Surrey average of £543,486, which is £106,285 above the county. The borough is not unusually expensive for big houses. It is unusually expensive for ordinary ones.
That is a straightforward consequence of what got built here. Stoneleigh, West Ewell and much of Worcester Park went up in the 1930s as railway suburbs, in semi-detached pairs, on plots close enough to a station to walk. Ninety years later the thing that made them sell is the thing still pricing them: a semi within ten minutes of a train that reaches Waterloo in half an hour. The semi is also the fastest-rising type in the borough, up 3.5% over the year, and it gained £21,737 in cash terms, more than any other type.
Flats are the exception at £300,022, the only type in the borough to fall over the year, and they are what pull the borough average of £568,214 below the semi-detached figure. On the index a flat here reads 96.2, so it is worth about 3.8% less than at the start of 2023, while a semi reads 103.5. If you are reading an “Epsom average” and picturing a house, the number you want is £491,420 and upward.
Where the borough ranks in Surrey
| District | Average price | Change over 12 months |
|---|---|---|
| Elmbridge | £748,080 | +1.9% |
| Epsom and Ewell | £568,214 | +2.0% |
| Mole Valley | £555,858 | +2.4% |
| Waverley | £553,429 | −2.6% |
| Guildford | £532,917 | −2.2% |
| Tandridge | £482,599 | −5.0% |
| Reigate and Banstead | £480,824 | −0.4% |
| Runnymede | £477,182 | +1.1% |
| Surrey Heath | £457,988 | +4.0% |
| Woking | £439,916 | −0.3% |
| Spelthorne | £439,609 | −2.9% |
Epsom and Ewell is the second dearest of the eleven and the third fastest-rising, behind Elmbridge on price and behind Surrey Heath and Mole Valley on growth. Only five Surrey districts rose at all over the year.
The neighbours across the London boundary are worth knowing too. Kingston upon Thames averaged £591,555 and rose 3.3%, so Worcester Park sits on a line where crossing the borough boundary now costs slightly more rather than less. Sutton averaged £452,654, which is £115,560 below Epsom and Ewell, and that gap is real enough to show up in what people pay either side of the Nonsuch Park boundary.
Against the wider picture, the borough is £45,691 above Surrey, £187,336 above the South East average of £380,878 and £274,735 above the England average of £293,479, which is very nearly double.
How many homes are actually selling
The same dataset counts transactions, and the count is low. The most recent month published is May 2026, with 54 sales in the whole borough. The index leaves out the two most recent months because registrations arrive late, and revises the rest for twelve months afterwards, so recent counts will rise.
- January to May 2026: 310 sales
- January to May 2025: 465 sales
- January to May 2024: 320 sales
Nearly all of the 2025 difference is one month. The borough registered 222 sales in March 2025, roughly triple a normal month, as buyers completed before the stamp duty thresholds changed on 1 April 2025. Strip March out of each year and the borough looks steady: 253 sales in the other four months of 2024, 243 in 2025 and 233 in 2026.
What it means for you
If you are buying, the direction of travel here is the opposite of most of Surrey, so waiting for a dip is a bet against the last twelve months of data. The value is in property type rather than timing: the flat market is the only one falling, at −0.4%, while semis run at 3.5%. Before you commit, check what is proposed near the address on the planning page, and see how little is being built: the borough completed 37 homes last year, none of them affordable.
If you are selling a semi or a terrace, the market is with you and has been all year. If you are selling a flat, it is not, and a 2023 asking price will sit.
If you are staying put, the borough has recovered its January 2023 value and a little more, which by Surrey standards this year is a good outcome. What is holding it up is not mysterious. It is the train: six stations inside one small borough, and Waterloo reachable in about forty minutes from the main one.
Frequently asked questions
What is the average house price in Epsom?
The average home in Epsom and Ewell borough sold for £568,214 in July 2026, according to the UK House Price Index, built from completed HM Land Registry sales. That covers every property type across the borough, flats included.
Are Epsom house prices rising or falling?
Rising over the year, but not over the month. Prices were up 2.0% in the year to July 2026 while Surrey as a whole fell 0.4%. Within July itself the borough average dipped 0.4%, the first monthly fall since January 2026.
How much is a house rather than a flat in Epsom?
A terraced house averaged £491,420, a semi-detached £649,771 and a detached house £982,917 in July 2026. The borough average of £568,214 is below the semi-detached figure because flats, at £300,022, make up a large share of sales.
Is Epsom more expensive than the rest of Surrey?
Yes, and it is the second dearest of the eleven Surrey districts after Elmbridge. The borough average is £45,691 above the Surrey average of £522,523. The gap is concentrated in semi-detached houses rather than detached ones.
Do these figures cover Ashtead and Leatherhead?
No. Ashtead and Leatherhead are in Mole Valley, which averaged £555,858, and Banstead and Tadworth are in Reigate and Banstead, which averaged £480,824. Only Epsom, Ewell, Stoneleigh, Worcester Park, West Ewell and the Downs are inside Epsom and Ewell borough.
Where can I check what a specific Epsom house sold for?
Every completed sale in England and Wales is public. Search a street or an address free on the HM Land Registry Price Paid service.
Sources
- Land Registry UK HPI open data, Epsom and Ewell, July 2026 for the borough average, property-type and buyer-type figures, the index and the annual and monthly changes.
- The equivalent records for Elmbridge, Mole Valley, Waverley, Guildford, Tandridge, Reigate and Banstead, Runnymede, Surrey Heath, Woking, Spelthorne, Kingston upon Thames, Sutton, Surrey, South East and England for the comparison tables.
- About the UK House Price Index for the averaging method, the revision policy and the treatment of sales volumes.
- HM Land Registry Price Paid search to check any individual address.
Updated 19 September 2026 with the July 2026 release, published on 18 September. Figures are provisional, are revised as more sales complete, and the index runs two to three months behind. The May figure this page previously carried, £568,755, has since been revised to £570,391. Confirm the latest numbers against the linked Land Registry sources before making a decision. What is being built next is on Epsom planning; what the commute costs is on Epsom to London trains.
Have your say