
The average Epsom and Ewell home reached £568,214 in July, up £11,146 in a year, while six of Surrey's 11 districts lost value and the county fell 0.4%.
The average home in Epsom and Ewell sold for £568,214 in July. That is £11,146 more than a year earlier, a rise of 2.0%.
Most of the county went the other way. Surrey as a whole fell 0.4% over the same twelve months. Six of its eleven districts lost value.
The figures are from the UK House Price Index, which HM Land Registry published on 18 September. They are built from completed sales lodged with the Land Registry, not from asking prices or mortgage approvals.
Two things about the number itself. It is an average for a whole borough, so it describes the market rather than any particular house. And it is a geometric mean, not a median, which is not the same measure most estate agents quote.
These figures cover Epsom and Ewell borough only: Epsom, Ewell, Stoneleigh, Worcester Park, West Ewell, Langley Vale and the Downs. They do not cover Ashtead or Leatherhead, which are in Mole Valley. They do not cover Banstead or Tadworth, which are in Reigate and Banstead.
Where the borough sits in Surrey
| Area | Average price | Change over 12 months |
|---|---|---|
| Surrey Heath | £457,988 | +4.0% |
| Mole Valley | £555,858 | +2.4% |
| Epsom and Ewell | £568,214 | +2.0% |
| Elmbridge | £748,080 | +1.9% |
| Runnymede | £477,182 | +1.1% |
| Woking | £439,916 | −0.3% |
| Reigate and Banstead | £480,824 | −0.4% |
| Guildford | £532,917 | −2.2% |
| Waverley | £553,429 | −2.6% |
| Spelthorne | £439,609 | −2.9% |
| Tandridge | £482,599 | −5.0% |
| Surrey | £522,523 | −0.4% |
| England | £293,479 | +1.1% |
Epsom and Ewell is third of the eleven. Only Surrey Heath and Mole Valley did better over the year.
The spread across the county is wide. Tandridge lost 5.0%, which is £25,656 off its average price in a year. Surrey Heath gained 4.0%. Between those two ends there is seven percentage points, in a county small enough to drive across in an hour.
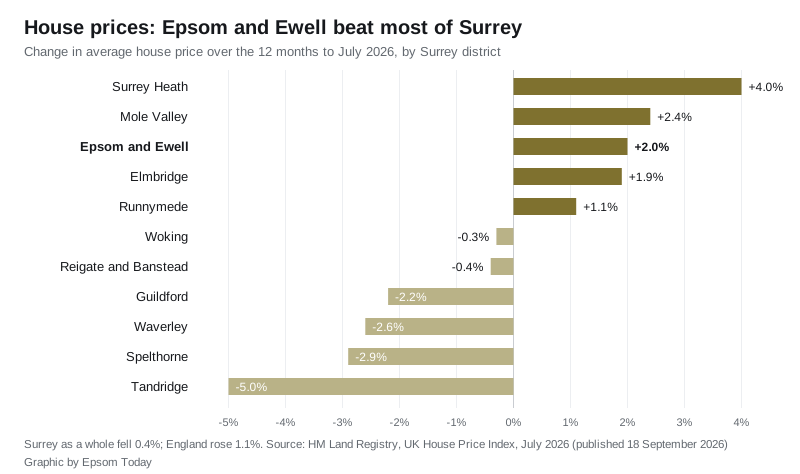
The borough also beat England, which rose 1.1%. That is unusual. For most of the past two years the national figure has been ahead of Epsom and Ewell.
The flat is the one type still going backwards
| Type | July 2026 | July 2025 | Change |
|---|---|---|---|
| Detached | £982,917 | £961,680 | +2.2% |
| Semi-detached | £649,771 | £628,034 | +3.5% |
| Terraced | £491,420 | £476,227 | +3.2% |
| Flat or maisonette | £300,022 | £301,355 | −0.4% |
The semi-detached house is doing the work. It rose £21,737 over the year. That is the largest gain of any type here, in cash as well as in percentage terms, and it edges out the detached house at £21,237 despite starting from a price a third lower.
The flat went the other way, down £1,333.
That gap shows up more starkly on the index itself, where January 2023 is set at 100:
- semi-detached: 103.5
- terraced: 103.5
- detached: 100.8
- flat or maisonette: 96.2
So a Stoneleigh or West Ewell flat is worth about 3.8% less than it was at the start of 2023, while a semi in the same streets is worth 3.5% more. Two households who bought within a few hundred yards of each other three and a half years ago have had opposite experiences.
Prices actually fell in July
The annual figure is up. The monthly one is not.
Epsom and Ewell fell 0.4% between June and July, from £570,573 to £568,214. It is the first monthly fall since January. The borough rose in each of the four months from February to May, then stood still in June:
- January 2026: £538,551
- February: £545,373
- March: £552,154
- April: £560,088
- May: £570,391
- June: £570,573
- July: £568,214
One month is not a trend, and the Land Registry treats recent months as provisional and revises them for up to a year afterwards. But it is worth noting before anyone reads the annual figure as momentum.
The longer view is flatter still. In January 2023 the borough average was £563,907. Three and a half years later it is £568,214. That is £4,307, or 0.8%, across the whole period. On the index the borough reads 100.8, against 98.7 for Surrey and 102.7 for England.
The number nobody publishes: how few homes are selling
The Land Registry also counts transactions, and this is where the Epsom and Ewell market looks different from the price line.
The most recent month with a sales count is May 2026: 54 sales in the whole borough. The index omits the two most recent months from its volume data, because registrations arrive late, and it revises the rest for twelve months afterwards. So the recent counts will rise.
Even allowing for that, the comparison is striking:
- January to May 2026: 310 sales
- January to May 2025: 465 sales
- January to May 2024: 320 sales
Almost all of the 2025 difference is a single month. Epsom and Ewell registered 222 sales in March 2025, roughly triple a normal month here. Stamp duty thresholds changed on 1 April 2025, and buyers completed early to beat it.
The same spike is visible nationally in the Land Registry’s own numbers. England registered 120,728 sales in March 2025, against 62,948 in February and 31,590 in April. In March 2026 the England figure was 49,882.
Strip March out of all three years and the borough looks steady rather than collapsing: 253 sales in the other four months of 2024, 243 in 2025, 233 in 2026.
What it means for you
If you are selling. The borough is one of five places in Surrey where the twelve-month figure is positive, and the semi-detached and terraced market is where the movement is. The July dip and the three-and-a-half-year picture both argue against assuming the number keeps climbing.
If you own a flat. Your type is the only one in the borough below where it was in January 2023. If you bought a flat in 2022 or early 2023 and are waiting to move up, the ladder has got longer, not shorter. The first-time buyer average here is now £422,793 and the former owner-occupier average is £703,851, a step of £281,058.
If you are buying. Transaction volumes are low, which cuts both ways: less competition, but also less choice. If you are comparing the borough with Ashtead, Leatherhead or Banstead, check the right district. Mole Valley averaged £555,858 in July and Reigate and Banstead £480,824, and both are within a few miles of Epsom.
If you are checking your council tax band. Council tax bands are still based on values at 1 April 1991 and do not move with these figures. Our Epsom council tax bands page has the full A to H table for 2026/27.
Our Epsom house prices page carries the full breakdown and has been updated to the July figures. For what is actually being built here, see our report on the 37 homes completed in the borough last year, and Epsom planning news for the applications in front of the council now.
A correction to our own figures
When we published the Epsom house prices page in August it gave the May 2026 average as £568,755, which was the figure the Land Registry had published at the time. May now reads £570,391, a revision upwards of £1,636. The June figure has moved too, from £568,810 as first published to £570,573.
That is normal. The index revises the previous twelve months every time it publishes. We would rather show the change than quietly overwrite it.
Sources: UK House Price Index, Epsom and Ewell (HM Land Registry, Open Government Licence); UK HPI reports collection; About the UK House Price Index. District and England figures taken from the same dataset for July 2026. The next release, covering August 2026, is due on 21 October.
Have your say